Data and Downloads
 Available is information regarding local economies around the United States.
The following are PDF's which you are welcome to download and use.
How to Create a Community Economic Development Incentives Program
Over the years, awarding incentives by local government to private companies which are either locating to or expanding in the area has been controversial.

Many communities have been very successful in creating prudent and effective incentive programs, others not so much.
Written by William H. Fruth as an educational tool for the local government officials and the economic development community, the study addresses the following issues:
· Why offer incentives?
· Economic Impact.
· Types of incentives.
· Objections to incentives.
· Issues which influence the economic impact on a Community.
· Structure of a local economic development incentives program.
To download the study, just click here.
Flow of Money
 Written by William H. Fruth, the 2018 edition of The Flow of Money ... How a local economy grows and expands is a twenty page booklet which teaches a lesson on how a local economy works and what most communities need to do to improve their area economy.
The Flow of Money has been created to educate community leaders, especially local government officials, on how a local economy functions and what areas need to do to build their economy.
It is used as a teaching tool in several economic development training programs. You are welcome to distribute it as you like. For a PDF of The Flow of Money, click here.
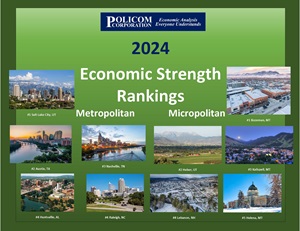
Economic Strength Rankings - 2024
Annually POLICOM ranks the 384 Metropolitan and 543 Micropolitan Statistical Areas for "economic strength."
Economic strength is the long-term tendency for an area to consistently grow in both size and quality.
The 2024 rankings utilized twenty-three economic factors measured over a twenty-year period for growth and consistency.
POLICOM conducts this analysis so it can study the characteristics of the strong and weak economies throughout the United States.
Statistical Area Definitions
The Office of Management and Budget (OMB) is charged with the task of defining the statistical areas in the United States.
The 2023 Economic Strength Rankings are based upon definitions published Bulletin 20-01, March 6, 2020. As of January 1, 2023, the OMB has not changed the definitions for the statistical areas.
 Statistical areas are used by economists and Federal agencies to measure economic activity. For the most part the geographic boundaries identify where a preponderance of the people live and work, earn and spend. The major criteria for determining the boundaries are commuting patterns of the populace.
Statistical Area Maps
 The federal government does not provide state maps which delineate the Metropolitan or Micropolitan areas.
POLICOM has created a map for each state and uses them in its research.
For maps based upon Bulletin 20-01, click 2020-2021 State Maps (PDF). The maps reflect the definitions as of January 1, 2023.

